Feed Conversion Ratio: Formula, Examples, and Feed Cost per Gain
By DietForge Team 5 min read
Topics: Feed Economics, Practical Calculations
Calculate FCR, combine group results correctly, and convert feed efficiency into feed cost per gain with worked examples and clear measurement boundaries.
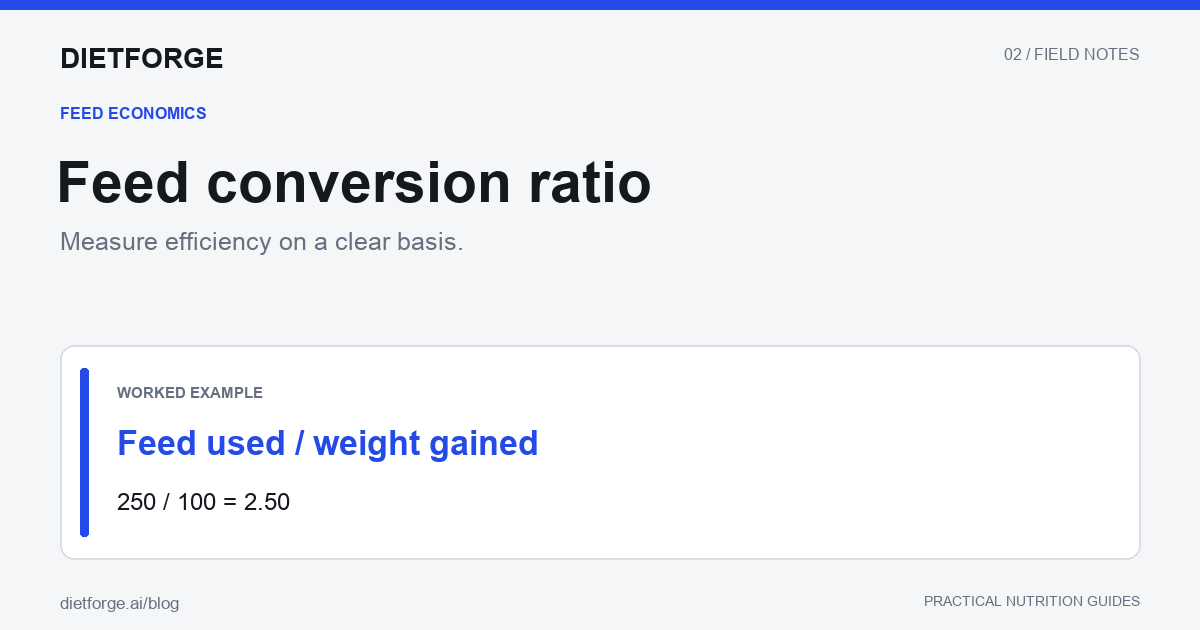
Feed conversion ratio, or FCR, is feed used divided by liveweight gained over the same period. If 250 kg of feed produces 100 kg of gain, FCR is 2.50 kg feed/kg gain. Lower FCR means less feed per unit of gain, provided the measurements and production conditions are comparable.
The definition is simple. Most reporting errors arise from choosing different boundaries for feed and gain, averaging ratios incorrectly, or assuming that the lowest FCR must deliver the lowest cost.
Choose the measurement boundary first
Decide whether “feed used” means feed delivered, feed disappearance after inventory adjustments, or estimated feed actually eaten. Those are different measurements. Feed remaining in a bin is not consumption; spilled feed may be an expense without being intake.
Pork Information Gateway’s feed-waste guidance describes why waste matters to pig production economics. Record your boundary next to the result, such as “as-fed feed disappearance per kg liveweight gain.” Do not compare it directly with a consumption-based research value without understanding the difference.
Calculate FCR from matched totals
In a hypothetical group of 100 pigs, average starting weight is 30 kg and average final weight is 60 kg. Assume no entries, exits, or deaths during the period. Group gain is 100 × (60 − 30) = 3,000 kg. If opening feed inventory plus deliveries minus closing inventory equals 7,500 kg, the group FCR is 7,500/3,000 = 2.50.
Use the same dates, animal group, and feed basis in both totals. Document scale calibration and inventory estimates. Where animals enter or leave, include their measured weights in a reconciled livestock balance. If deaths occur, specify the mortality adjustment instead of silently treating every system’s reported FCR as equivalent.
FCR is not the same as gain-to-feed
| Measure | Formula | Example |
|---|---|---|
| Feed-to-gain / FCR | Feed ÷ gain | 250 ÷ 100 = 2.50 |
| Gain-to-feed / G:F | Gain ÷ feed | 100 ÷ 250 = 0.40 |
| Relationship | G:F = 1 ÷ FCR | 1 ÷ 2.50 = 0.40 |
Higher G:F indicates greater conversion efficiency, while lower FCR does. A column called “feed efficiency” needs an explicit definition because people use that label for both. The ratio is only reciprocal when both calculations use identical feed and gain totals.
Combine groups using totals, not an unweighted average
Group A uses 240 kg feed for 100 kg gain, giving FCR 2.40. Group B uses 810 kg for 300 kg gain, giving FCR 2.70. Their combined FCR is (240 + 810)/(100 + 300) = 2.625. The simple average, 2.55, is wrong because the groups produced different amounts of gain.
The equivalent weighted average weights each FCR by its share of total gain. Apply the same principle when combining pens, phases, or farms. Averaging monthly dashboard ratios without their denominators can disguise a change in the production mix.
Convert FCR into feed cost per unit of gain
Feed cost per kg gain = FCR × feed price per kg. At 2.50 kg feed/kg gain and $0.30/kg feed, feed cost is $0.75/kg gain. A competing feed priced at $0.32/kg with FCR 2.30 costs $0.736/kg gain. It is more expensive per tonne but slightly cheaper per kg gained.
These are illustrative scenarios, not predicted responses to a feed change. If multiple feeds were used, calculate actual total feed cost divided by total gain. Multiplying a phase’s FCR by an unrelated purchase price can misstate the outcome.
For a break-even comparison, divide the baseline cost per gain by the alternative feed price. Here $0.75/$0.32 = 2.34375. The alternative must achieve FCR below about 2.344 to beat the baseline on feed cost alone.
Keep biological comparisons fair
FCR depends on the species, weight interval, feed basis, environment, health, and production system. Gut fill and water changes can affect short-period liveweight measurements. A result from young animals should not become a universal target for finishing animals.
Also consider daily gain, mortality, sale specifications, days occupying facilities, and non-feed costs. A diet can lower feed cost per gain while slowing throughput enough to reduce the overall business result. Our swine feed-economics guide separates these objectives.
Key takeaways
- Match feed and gain to the same animals, dates, and measurement rules.
- Combine groups by dividing total feed by total gain.
- Multiply FCR by feed price to calculate feed cost per gain.
- Compare financial outcomes as well as biological efficiency.
Frequently asked questions
What is a good FCR?
There is no single target across species and production stages. Use an appropriate benchmark with the same weight interval, feed basis, and mortality treatment.
Should feed be measured as-fed or as dry matter?
Either basis can be reported if it is explicit and used consistently. Wet and dry feeds require a common basis for a meaningful comparison; see our conversion guide.
Does DietForge model feed cost per gain for every species?
No. DietForge supports formulation across its available species, but its built-in growth, cost-per-gain, and income-over-feed-cost tools currently cover swine. Economics models for other livestock species are planned.
Apply the numbers to a formulation
Keep measured performance separate from model predictions. Explore DietForge’s plans to compare formulation workflows and the swine economics tools available in Pro.